Thursday, July 31, 2014
How do some firms become large? GCEO
Some firms become large by various ways. One of the important methods is by merger or integration of two or more firms. This can be in the form of horizontal merger where two similar firms join together or lateral merger where two different firms merge. This can also be possible in different stages of production. Secondly Advertising is also one possible way to grow since it generates higher demand and sales which result a need of higher capacity. Moreover issuing shares also increases the company’s capital and size.
Why might a government wish to create jobs?
Government wishes to create jobs due to various reasons. Firstly, Job creation increases the production, income and the employment of the country. This gives a greater benefit for the people of the country and the country as well. Secondly this increase in production and income results an increase in economic growth which gives a lot of benefits such as improvement in living standard. Moreover, this helps to achieve government aims of full employment, economic growth and positive results to the balance of payment. And also increase demand for goods and services. wBwy: Awlim.studyguide.
Policies to encourage private business
Explain the policies that a government might use to encourage private businesses. [6]
Government might use various policies to encourage the private businesses. One of the most important policy is that granting subsidies which encourage the business by reduction in their cost of production and increase in the output. Secondly, government can bring changes in the taxation. Reduction in the tax rate also is an incentive to business to increase their production. Moreover, some government gives grants such as new machines free labours to some businesses which are again an incentive for the businesses.
Government might use various policies to encourage the private businesses. One of the most important policy is that granting subsidies which encourage the business by reduction in their cost of production and increase in the output. Secondly, government can bring changes in the taxation. Reduction in the tax rate also is an incentive to business to increase their production. Moreover, some government gives grants such as new machines free labours to some businesses which are again an incentive for the businesses.
Importance of investment in an economy
Explain why investment is important in an economy. [6]
Investment means an increase in the real stock of capital goods. Investment is important for an economy because it generates lots of positive effects for the economy. Firstly , an investment create lot of job opportunities where people of the country gets a chance to work and at the same time this opportunities increase their income as well as the national income. Secondly, increase in investment brings an increased international competitiveness where people enjoy wide variety of superior quality goods and services at cheaper price. Finally, it increases the economic growth of the country by increasing the total production of the country.
Investment means an increase in the real stock of capital goods. Investment is important for an economy because it generates lots of positive effects for the economy. Firstly , an investment create lot of job opportunities where people of the country gets a chance to work and at the same time this opportunities increase their income as well as the national income. Secondly, increase in investment brings an increased international competitiveness where people enjoy wide variety of superior quality goods and services at cheaper price. Finally, it increases the economic growth of the country by increasing the total production of the country.
What is Economic growth?
What is meant by economic growth? [3]
Economic growth can be defined as an increase in the total output of the country. This may be in the form of increase in Gross domestic product of the country. Economic growth brings various benefits such as employment opportunities, increase in income, and improvement in the living standard. etc…
Economic growth can be defined as an increase in the total output of the country. This may be in the form of increase in Gross domestic product of the country. Economic growth brings various benefits such as employment opportunities, increase in income, and improvement in the living standard. etc…
Wednesday, July 30, 2014
How do you explain Economies of scale
Economies of Scale
The Long run-Increases in scale
A firm’s efficiency is affected by its size. Large firms are often more efficient
than small ones because they can gain from economies of scale, but firms can
becometoo
large and suffer from diseconomies of scale. As a firm expands its
scale of operations, it is said to move into its long run. The
benefits arising from expansion depend upon the effect of expansion on productive efficiency, which can be assessed by looking at changes in average costs
at each stage of production.
How
does a firm expand?
A
firm can increase its scale of operations in two ways.
1.
Internal growth,
also called organic growth
2.
External growth, also called integration - by merging with other firms, or by
acquiring other firms
By
growing, a firm can expect to reduce its average costs and become more
competitive.
Long run costs
The firm’s long run average
cost shows what is happening
to average cost when the firm expands, and is at a tangent to the series of
short run average cost curves. Each short run average cost curve relates to a
separate stage or phase of expansion.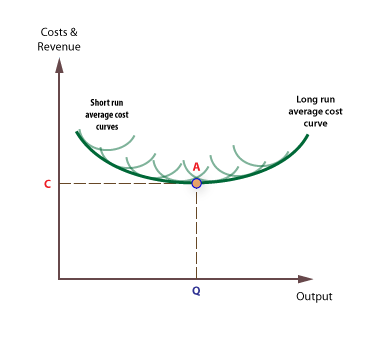
The
reductions in cost associated with
expansion are called economies
of scale.
Internal and external economies and
diseconomies of scale
External economies and diseconomies
External
economies and diseconomies of scale are the benefits and costs associated with
the expansion of a whole
industry and result from external factors
over which a single firm has little or no control.
External diseconomies are costs which are outside the
control of a single firm and result of the growth of a specific industry. For
example, negative externalities,
such as road congestion, can result from the growth of an industry in a
specific region. Resoures may become exhausted and the price of resources may
rise as demand outstrips supply.
Internal economies and diseconomies
Internal
economies and diseconomies of scale are associated with the expansion of a single firm.
The
long run cost curve for most firms is assumed to be ‘U’ shaped, because of the
impact of internal economies and diseconomies of scale.

However,
economic theory suggests that average costs will eventually rise because of diseconomies of scale.
Types
of internal economy of scale
1.
Technical economies are the cost savings a firm makes
as it grows larger, and arise from the increased use of large scale mechanical
processes and machinery. For example, a mass producer of motor vehicles can
benefit from technical economies because it can employ mass production
techniques and benefit from specialisation and a division of labour.
2.
Purchasing economies are gained when larger firms buy in
bulk and achieve purchasing discounts. For example, a large supermarket chain
can buy its fresh fruit in much greater quantities than a small fruit and
vegetable supplier.
3.
Administrative savings can arise when large firms spread
their administrative and management costs across all their plants, departments,
divisions, or subsidiaries. For example, a large multi-national can employ one
set of financial accountants for all its separate businesses.
4.
Large
firms can gain financial
savings because they can usually borrow
money more cheaply than small firms. This is because they usually have more
valuable assets which can be used as security (collateral), and are seen to be
a lower risk, especially in comparison with new businesses. In fact, many new
businesses fail within their first few years because of cash-flow inadequacies.
For example, for having a bank overdraft facility, a supermarket may be charged
2 or 3 % less than a small independent retailer.
5. Risk bearing economies are often derived by large
firms who can bear business risks more effectively than smaller firms. For
example, a large
record company can more easily bear the risk of a ‘flop’ than a smaller record
label.
Internal diseconomies of scale
Economic theory also
predicts that a single firm may become less efficient if it
becomes too large. The additional costs of becoming too large arge are called diseconomies of scale
Examples
of diseconomies include:
1.
Larger
firms often suffer poor
communication because they find it difficult to
maintain an effective flow of information between departments, divisions or
between head office and subsidiaries. Time lags in the flow of information can
also create problems in terms of the speed of response to changing market
conditions. For example, a large supermarket chain may be less responsive to
changing tastes and fashions than a much smaller, ‘local’ retailer.
Co-ordination problems also affect large firms
with many departments and divisions, and may find it much harder to co-ordinate
its1.
the
activities of its small number of staff than a large manufacturer employing
tens of thousands.
2.
‘X’ inefficiency is the loss of management
efficiency that occurs when firms become large and operate in uncompetitive
markets. Such loses of efficiency include over paying for resources, such as
paying managers salaries higher than needed to secure their services, and
excessive waste of resources. ‘X’ inefficiency means that average costs are
higher than would be experienced by firms in more competitive markets.
4.
Low motivation of workers in large firms is a potential
diseconomy of scale that results in lower productivity, as measured by output
per worker.
Large firms may experience
inefficiencies related to the principal-agent problem. This problem is caused
because the size and complexity of most large firms means that their owners
often have to delegate decision making to appointed managers, which can lead to
inefficiencies. For example, the owners of a large chain of clothes
retailers will have to employ managers for each store, and delegate some of the
jobs to managers but they may not4.
necessarily
make decisions in the best interest of the owners. For example, a store manager
may employ the most attractive sales assistant rather than the most productive
one.
Falling
long run costs
Some
firms may experience a continuous fall in long run average costs. These may
become natural monopolies
Minimum Efficient Scale
A
firm’s minimum
efficient scale (MES) is the lowest scale necessary
to achieve the economies of scale required to operate efficiently and
competitively in its industry. No further significant economies of scale can be
achieved beyond this scale.
Minimum
efficient scale affects the number of firms that can operate in a market, and
the structure of markets.

When
minimum efficient scale is low, relative to the size of the whole industry, a
large number of firms can operate efficiently, as in the case of most retail
businesses, like corner shops and restaurants.
However,
if minimum efficient scale can only be achieved at very high levels of output
relative to the whole industry, the number of firms in the industry will be
small. This is case with natural monopolies ,
such as water, gas, and electricity supply.
Tuesday, July 29, 2014
Next Russian world cup Football FIFAS COMMENT
FIFA DISAGREES
Some German politicians have also called for Russia to be stripped of the right to host the tournament, but FIFA, soccer's world governing body, has so far resisted the demands, saying the competition could be "a force for good".
Almost 200 Dutch citizens lost their lives in the incident and the Dutch football association has said it will meet in due course to decide if it will take part in the qualifying competition for the finals in Russia.
Western politicians have taken an increasingly tough line on Russia since the downing of MH17, accusing Moscow of arming the separatists there, something Russia denies.
Clegg said the world would look weak and insincere if it allowed Russia to stage the World Cup it without a change of course by Putin in Ukraine.
"You can’t have this - the beautiful game marred by the ugly aggression of Russia on the Russian-Ukrainian border," he said.
Britain's opposition Labour party also said stripping Russia of the World Cup should be an option if its complicity in the downing of MH17 was proven and if Putin did not change course.
"Fifa should be considering contingencies now and any discussion should happen quickly, so that if necessary, alternative plans are in place in time for teams and fans from around the world," Douglas Alexander, Labour's spokesman on foreign affairs, said in a statement.
Britain, which is home to many wealthy Russians, said on Saturday it thought it highly likely that MH17 was shot down from a separatist-controlled area with a missile system supplied by Moscow.
Russia's ambassador to Britain has said Moscow is only providing humanitarian aid to the separatists. He said there was no proof of his country's involvement.
Clegg also said Russia should not be allowed to host a Formula One Grand Prix in October, but F1 boss Bernie Ecclestone has said that event will go ahead as planned.
What is Opportunity Cost?
What Is Opportunity Cost?
The basic economic problem is the issue of scarcity. Because resources are scarce but wants are unlimited, people must make choices. This lesson showcases the most important concept in macroeconomics, which is the concept of opportunity cost. Very simply, everyone has the same amount of hours in a day, but we all make different decisions about what we do, what we choose to buy, and how we spend our time. What determines these choices? Opportunity cost does.
Every time you make a choice, there is a certain value you place on that choice. You might not know it or think about it, but every choice has a value to you. When you choose one thing over another, you're saying to yourself, I value this more than another choice I had.
The opportunity cost of a choice is what you gave up to get it. If you have two choices - either an apple or an orange - and you choose the apple, then your opportunity cost is the orange you could have chosen but didn't. You gave up the opportunity to take the orange in order to choose the apple. In this way, opportunity cost is the value of the opportunity lost.
Value: Benefits And Cost
Value has two parts to it. It has benefits as well as costs. If you choose an apple over an orange, maybe the apple costs less, but maybe you enjoy it more. So, looking at choice in terms of benefits and costs helps you make better economic decisions. To make a good economic decision, we want to choose the option with the greatest benefit to us but the lowest cost.
Monetary Value
For example, if we graduate from college and suddenly find ourselves in the job market, there are choices to be made. Let's say that two jobs become available to us. We can either work for Company A or Company B. The job with Company A promises to pay us $20 an hour, while Company B offers to pay us only $10. Based on this information alone, of course most people would choose Company A.
Why? Because Company A is paying a higher salary. But when you look at this kind of a choice in only dollar terms, you're only seeing it from the perspective of the benefits. Let's take that same example, but now we discover that the job for Company A requires a fancy dress suit that will cost you $1,500. You realize that the job with the higher salary may not be worth it to you. Now you're starting to think economically. You're thinking economically when you look at the value of a choice through the eyes of its benefits and costs.
Whatever we choose, the opportunity cost is the value of the choice we could have had. The opportunity cost of working for Company A is the value of what we gave up to take the job. We gave up the value of working for Company B, so that is the opportunity cost of choosing to work for Company A. In this example, we focused more on the monetary costs. The challenge is, most people get stuck evaluating choices only in monetary terms, but there's more to the story.
Value Of Time
The value of a choice to you might be in terms of time or in terms of the enjoyment you could have experienced. When Benjamin Franklin originally explained this concept in his book, titled Advice to a Young Tradesman, he said that 'time is money.' He was trying to communicate the concept of opportunity cost by saying that what you do with your time, whether or not you are productive, can be just as important as any decision you make with money.
choices and opportunity cost
People's choices about what goods and services to buy and consume determine how resources will be used. The choices people make have both present and future consequences - consider for example the decision of students to stay on in full-time education after GCSE exams and A-Levels. You are forsaking some lost earnings in the short run (rarely can students study and hold down a full-time job!) but have the prospect of increased earnings potential in the future if you succeed on your course and achieve good grades.
There is a famous saying in economics that "there is no such thing as a free lunch". Even if we are not asked to pay for consuming a good or a service, scarce resources are used up in the production of it and there must be some opportunity cost involved - the next best alternative that might have been produced using those resources.
Opportunity cost measures the cost of any economic choice in terms of the next best alternative foregone
Many examples of opportunity cost exist at the level of the individual, the household, the firm, the government and the economy:
- The opportunity cost of deciding not to work is the lost wages foregone
- The opportunity cost of spending money on a foreign holiday is the lost opportunity to buy a new dishwasher or the chance to enjoy two short breaks inside the United Kingdom
- The opportunity cost of the government spending £20 billion on interest payments on the national debt is the extra money it might have allocated to the National Health Service
- The opportunity cost of an economy investing its resources in new capital goods is the current production of consumer goods that is given up
- The opportunity cost of using arable farm land to produce wheat is that the land cannot be used in that production period to harvest potatoes
Monday, July 28, 2014
IGCSE-GCEO level notes,Demand and Supply
Supply and Demand
Supply and demand is perhaps one of the
most fundamental concepts of economics and it is the backbone of a market
economy. Demand refers to how much (quantity) of a product or service is desired
by buyers. The quantity demanded is the amount of a product people are willing
to buy at a certain price; the relationship between price and quantity demanded
is known as the demand relationship. Supply represents how much the market can offer. The quantity supplied
refers to the amount of a certain good producers are willing to supply when
receiving a certain price. The correlation between price and how much of a good
or service is supplied to the market is known as the supply relationship.
Price, therefore, is a reflection of supply and demand.
The relationship between demand and supply underlie the forces behind the allocation of resources. In market economy theories, demand and supply theory will allocate resources in the most efficient way possible. How? Let us take a closer look at the law of demand and the law of supply.
A. The Law of Demand
The law of demand states that, if all other factors remain equal, the higher the price of a good, the less people will demand that good. In other words, the higher the price, the lower the quantity demanded. The amount of a good that buyers purchase at a higher price is less because as the price of a good goes up, so does the opportunity cost of buying that good. As a result, people will naturally avoid buying a product that will force them to forgo the consumption of something else they value more. The chart below shows that the curve is a downward slope.

A, B and C are points on the demand curve. Each point on the curve
reflects a direct correlation between quantity demanded (Q) and price (P). So,
at point A, the quantity demanded will be Q1and the price will be P1, and so
on. The demand relationship curve illustrates the negative relationship between
price and quantity demanded. The higher the price of a good the lower the
quantity demanded (A), and the lower the price, the more the good will be in
demand (C).
B. The Law of Supply
Like the law of demand, the law of supply demonstrates the quantities that will be sold at a certain price. But unlike the law of demand, the supply relationship shows an upward slope. This means that the higher the price, the higher the quantity supplied. Producers supply more at a higher price because selling a higher quantity at a higher price increases revenue.
Like the law of demand, the law of supply demonstrates the quantities that will be sold at a certain price. But unlike the law of demand, the supply relationship shows an upward slope. This means that the higher the price, the higher the quantity supplied. Producers supply more at a higher price because selling a higher quantity at a higher price increases revenue.

A, B and C are points on the supply
curve. Each point on the curve reflects a direct correlation between quantity
supplied (Q) and price (P). At point B, the quantity supplied will be Q2 and
the price will be P2, and so on. (To learn how economic factors are used in
currency trading, read Forex Walkthrough: Economics.)
Time and Supply
Time and Supply
Unlike the demand relationship, however, the supply relationship is a factor of time. Time is important to supply because suppliers must, but cannot always, react quickly to a change in demand or price. So it is important to try and determine whether a price change that is caused by demand will be temporary or permanent.
Let's say there's a sudden increase in the demand and price for umbrellas in an unexpected rainy season; suppliers may simply accommodate demand by using their production equipment more intensively. If, however, there is a climate change, and the population will need umbrellas year-round, the change in demand and price will be expected to be long term; suppliers will have to change their equipment and production facilities in order to meet the long-term levels of demand.
C. Supply and Demand Relationship
Now that we know the laws of supply and demand, let's turn to an example to show how supply and demand affect price.
Imagine that a special edition CD of your favorite band is released for $20. Because the record company's previous analysis showed that consumers will not demand CDs at a price higher than $20, only ten CDs were released because the opportunity cost is too high for suppliers to produce more. If, however, the ten CDs are demanded by 20 people, the price will subsequently rise because, according to the demand relationship, as demand increases, so does the price. Consequently, the rise in price should prompt more CDs to be supplied as the supply relationship shows that the higher the price, the higher the quantity supplied.
If, however, there are 30 CDs produced
and demand is still at 20, the price will not be pushed up because the supply
more than accommodates demand. In fact after the 20 consumers have been
satisfied with their CD purchases, the price of the leftover CDs may drop as CD
producers attempt to sell the remaining ten CDs. The lower price will then make
the CD more available to people who had previously decided that the opportunity
cost of buying the CD at $20 was too high.
D. Equilibrium
D. Equilibrium
When supply and demand are equal (i.e. when the supply function and demand function intersect) the economy is said to be at equilibrium. At this point, the allocation of goods is at its most efficient because the amount of goods being supplied is exactly the same as the amount of goods being demanded. Thus, everyone (individuals, firms, or countries) is satisfied with the current economic condition. At the given price, suppliers are selling all the goods that they have produced and consumers are getting all the goods that they are demanding.

In the real market place equilibrium can only ever be reached in theory, so the prices of goods and services are constantly changing in relation to fluctuations in demand and supply.
E. Disequilibrium
Disequilibrium occurs whenever the price or quantity is not equal to P* or Q*.
1. Excess Supply
If the price is set too high, excess supply will be created within the economy and there will be allocative inefficiency.
In this situation, at price P1, the quantity of goods demanded by
consumers at this price is Q2. Conversely, the quantity of goods that producers
are willing to produce at this price is Q1. Thus, there are too few goods being
produced to satisfy the wants (demand) of the consumers. However, as consumers
have to compete with one other to buy the good at this price, the demand will
push the price up, making suppliers want to supply more and bringing the price
closer to its equilibrium.
F. Shifts vs. Movement
F. Shifts vs. Movement
For economics, the "movements" and "shifts" in relation to the supply and demand curves represent very different market phenomena:
1. Movements
A movement refers to a change along a curve. On the demand curve, a movement denotes a change in both price and quantity demanded from one point to another on the curve. The movement implies that the demand relationship remains consistent. Therefore, a movement along the demand curve will occur when the price of the good changes and the quantity demanded changes in accordance to the original demand relationship. In other words, a movement occurs when a change in the quantity demanded is caused only by a change in price,


A shift in a demand or supply curve occurs when a good's quantity demanded or supplied changes even though price remains the same. For instance, if the price for a bottle of beer was $2 and the quantity of beer demanded increased from Q1 to Q2, then there would be a shift in the demand for beer. Shifts in the demand curve imply that the original demand relationship has changed, meaning that quantity demand is affected by a factor other than price. A shift in the demand relationship would occur if, for instance, beer suddenly became the only type of alcohol available for consumption.


Subscribe to:
Posts (Atom)